
As a result of my numerous opportunities to be in junior classrooms I have noticed that many students are able to create, identify and extend patterns. The challenge that I have observed over and over again is the difficulty these students have making future predictions based on the identified pattern. They are not making the link between patterning and algebra. Many patterns are of an additive nature, but the ability to make predictions involves multiplicative thinking. Some questions come to mind as I ponder this: Are we spending too much time on the “doing” part of patterning and not enough time on the “thinking” (algebraic reasoning)? Are we teaching patterning and algebra as two separate mathematical ideas? What can we do in the early years to start making links to this ability to make future predictions? What educator moves impact student thinking?
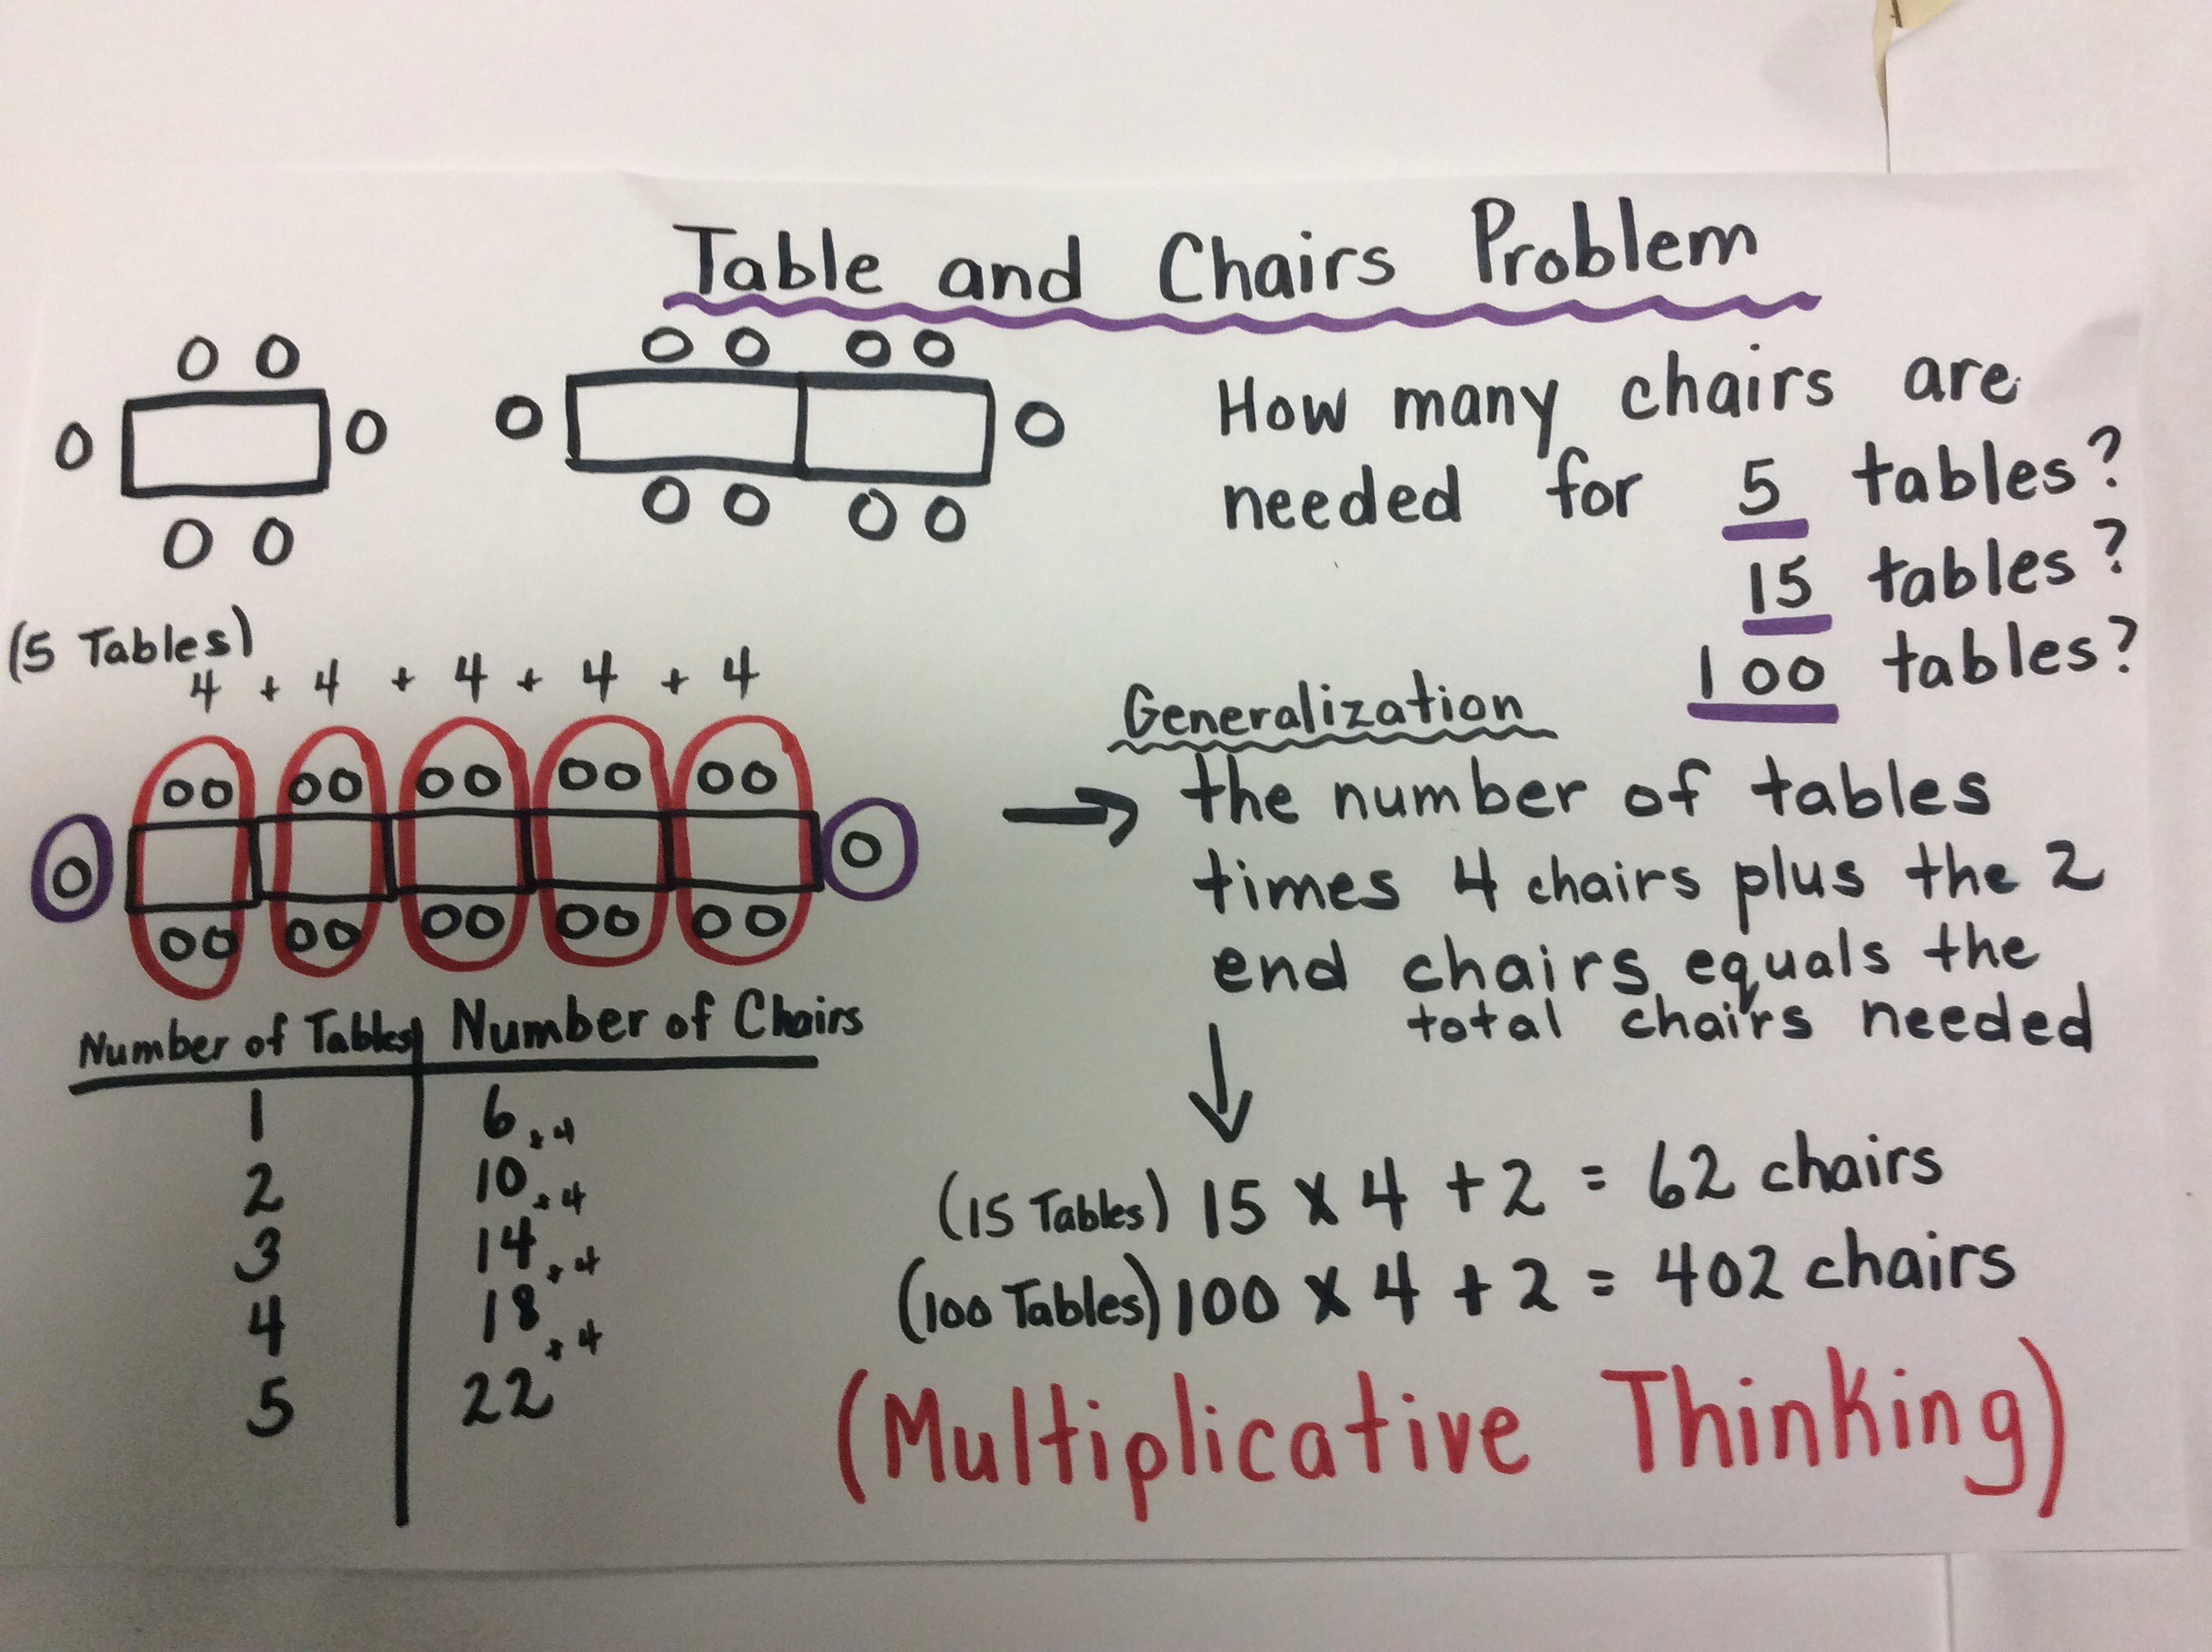
I really like the table and chairs problem (see diagram) because it is an example of a task that allows for multiple entry points for students. It is also a problem that allows educators to make links between patterning and algebra using student work during the consolidation part of the lesson. When working on this problem I want students to build the first few terms and record on a t-chart, but just as Dr. Marian Small suggests it is important not to give students too many manipulative so that they begin to look for patterns and number relationships so that predictions can be made. I have implemented this lesson many times in classrooms and many “light bulbs” go on during the consolidation. Students who are able to create and extend patterns often leave understanding how to make predictions for future terms. Here is an example of what I do.
Students in a Grade 5-6 classroom were asked to solve this problem. During the consolidation I circled the two end chairs in blue and introduced the math term “constant”. I circled the part that kept repeating in a different colour (red). I made very explicit connections between the visual representation and the t-chart. When making the link between the addition in these two representations and the multiplication that I am aiming for so that predictions can be made I use words such as : the number of tables times the 4 chairs plus the 2 end chairs equals the total number of chairs needed. I point to the visual and the chart when saying this. I do this because I want them to understand what the numbers mean when I write this: (15 x 4 ) + 2 = 62. Through the visual representation the students see that the 2 end chairs always stay the same and the number of chairs increase by 4 every time a table is added. The chart allows students to see the numbers increasing by 4 each term. We test this out (the number of tables times the 4 chairs plus the 2 end chairs equals the total number of chairs needed) with a small number of tables and confirm the answer on the chart. We then move on to predicting for a larger number of tables beyond what is on the chart. The students generally start getting very excited about now because they discover they can calculate how many chairs would be needed for 1000 tables. When we make explicit links between patterning and algebra in a meaningful context and do not view them as separate math ideas then (4x)+2=y makes perfect sense!
Hi Vicki,
I thought you were retired!? LOL
I love your blog! Keep it up!
Karen